Prolink December 2020 Newsletter
Personal Note
As we approach the year end and the holidays please accept our best wishes for you and your family.
Without question, this has been a year that will not be forgotten soon.
We look forward to continuing to bring you the latest in Data Collection and SPC Software.
Product Spotlight: QC-Mobile
This newsletter is dedicated to QC-Mobile and its unique data visualization capabilities which are especially relevant to our world
today and the fact that many of us are working remotely either part or full time. QC-Mobile
provides the most advanced data analysis and viewing capability while requiring no software or app to be installed
on your device. All that is required is a device with a browser and a connection to your local network.
QR Codes Throughout
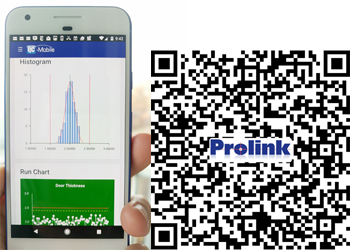
QC-Mobile has long included the ability to display any screen/report that is produced by ERS, QC-CALC Real-Time, or SPC Office Buddy. However, one of the most exciting features of QC-Mobile (and an industry first) is the ability to be driven by QR codes. QR codes, created in ERS, can be printed or displayed on production machines anywhere in the plant allowing quick access to relevant information about the machine/cell/department. A simple scan from your device's camera app can display pages such as Dashboards or Live plots in QC-Mobile bringing hyperlinks to the physical world. A brand new feature of QR codes, called Impersonation Codes, allows anyone to scan a code and view a specific target page without the login requirement or any knowledge of how the system works. It's as simple as scanning a menu in a restaurant...Learn More about Impersonation Codes
QR codes can also now be added to printed and PDF reports. These QR codes can be set to display additional information related to the data on the report. For instance, a QR code placed on a Histogram Report could cause bring up an electronic version of the report itself or be set to display a live Stat Summary using the same filtering. QR codes displayed on reports bring a new dimension to the flexibility and depth of data visualization.
Learn More about creating QR-Codes
Part Summary Display in Snapshots
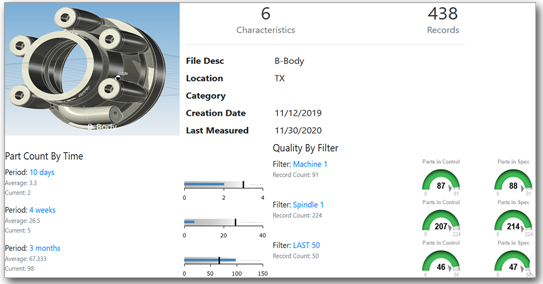
Located on the Snapshot page in QC-Mobile, this new feature allows a user to select any part number and immediately get a display showing CAD views of the part, part counts over time (days, weeks, months), and part quality by filter such as machine, spindle, cavity, etc. Each of the displays provides links to drill down to a stats summary or live plot display. As expected, it can be linked via a QR code.Learn More about Part Summary
Updates to Statistical Summary
The QC-Mobile Stat Summary screen has also received significant revisions. The former Floating Bar chart has been upgraded to a Candlestick Chart showing the extent of the Min/Max, the distribution via 25th and 75th percentiles, the mean, and the median. At the bottom, an optional raw data grid was also added.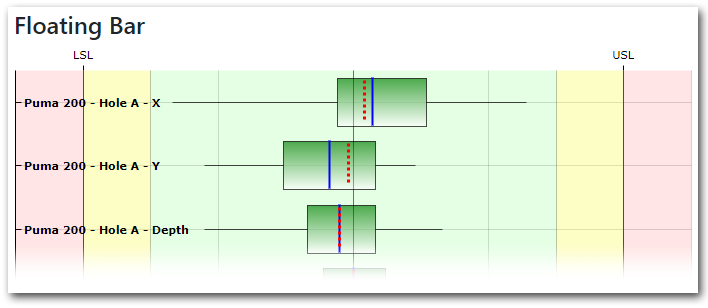
All in all, it is safe to say that QC-Mobile has really "come of age" and can provide easy access to serious quality
data in the simplest, most economical method available.
Learn More at an Online Demo for QC-Mobile
Learn More at an Online Demo for QC-Mobile
Don't Forget
Sign up for our software update emails announcing releases of new versions of our software. Never miss out on a new feature again by subscribing now!
Subscription Preferences
Join one of our Q & A Sessions held twice a week. Our specialist will answer questions on QC-CALC Real-Time, QC-CALC SPC, QC-Gage or SPC Office Buddy and more. Sign up and learn how to maximize the features in Prolink Software.
Learn More at an Online Demo
Subscription Preferences
Join one of our Q & A Sessions held twice a week. Our specialist will answer questions on QC-CALC Real-Time, QC-CALC SPC, QC-Gage or SPC Office Buddy and more. Sign up and learn how to maximize the features in Prolink Software.
Learn More at an Online Demo

Manage your communication preferences | unsubscribe
© Prolink Software Corporation 2020