Prolink’s strategic partnership with Becker Quality Solutions, Inc. takes quality to the next level. Becker Quality Solutions' new Process Toolbox combines measurement data from QC-CALC with engineering knowledge to produce very specific operator instructions that are easily executed. For additional information on the Process Toolbox, please contact Larry Becker at Becker Quality Solutions at www.beckerqualitysolutions.com.
How It Works
The process engineer enters all the typical problems that can cause a failure in his specific process into the Process Toolbox Editor. With each issue that is entered, the engineer builds in the solution to the issue using a combination of messages and calculations. The Process Toolbox Viewer then runs in the background collecting output data from QC-CALC and watching for patterns within the data. When a problem is detected, the operator is immediately notified allowing him to fix a potential issue before it leads to scrap. It's literally like having your best process engineer present 24 hours a day!
An Example
The following sequence of events happens automatically without operator intervention. Here is a typical sequence:
- The part is inspected on a CMM
- The data is read and displayed by QC-CALC
- QC-CALC transmits data to Becker Process Toolbox (Viewer)
- The viewer runs mathematical equations and instructions using the QC-CALC data 5. A report is displayed to the machine operator on his local PC.
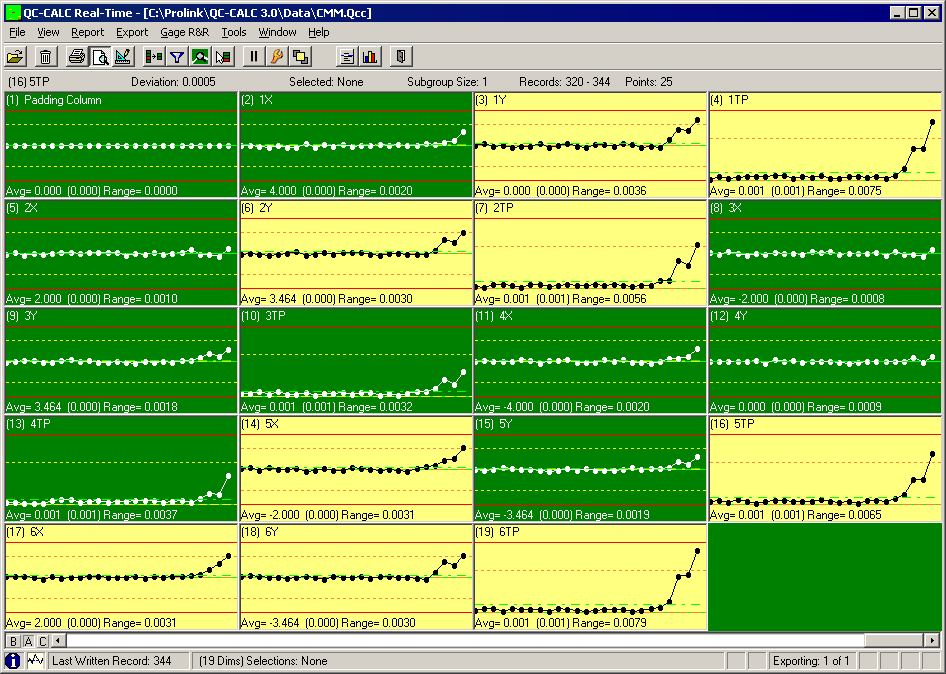
The example screen below is a set of QC-CALC live plots showing the results of inspecting 25 parts containing a bolt hole pattern. The last few parts are showing a shift in the process but it is difficult to determine what process adjustments are needed to correct the problem. Bolt hole patterns have a complex relationship between the holes and the overall centering of the pattern.
The Process is Good
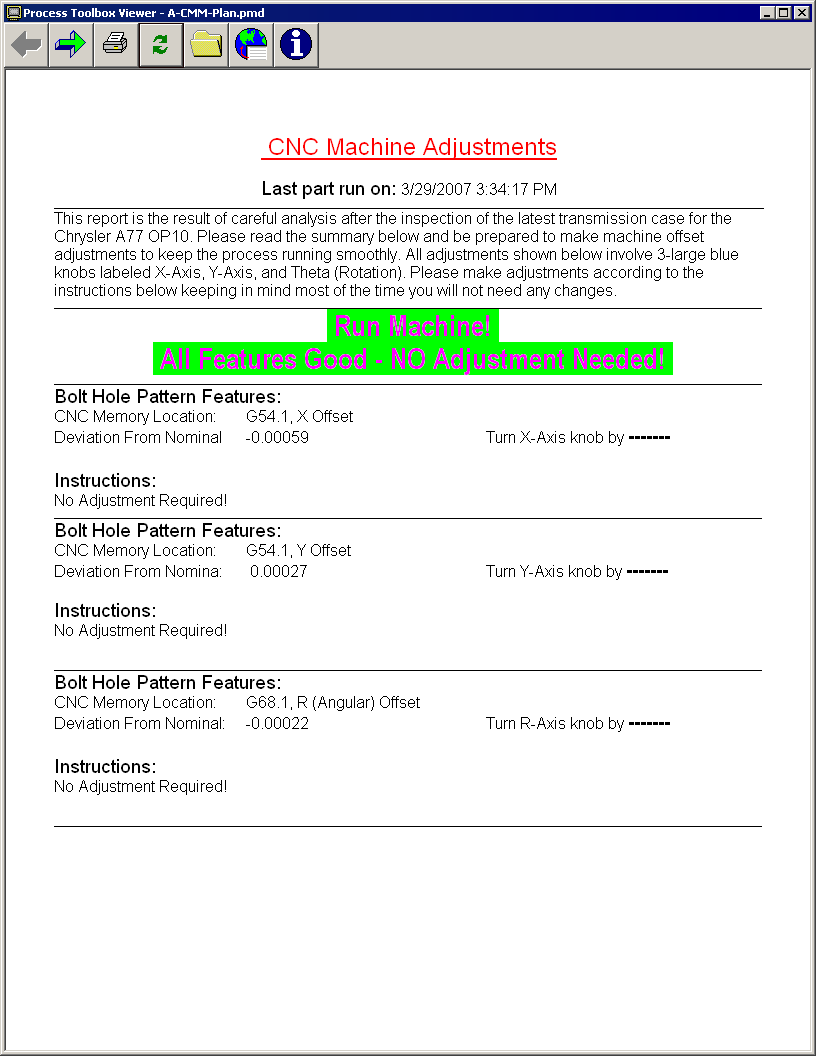
This sample report is the Process Toolbox Viewer and was triggered automatically on the machine operator’s monitor. This type of report is displayed during the first half of the QC-CALC screen where the process numbers are in control. This report updates after each part to ensure the operator knows his setup is accurate.
The Process is Beginning to Go Bad
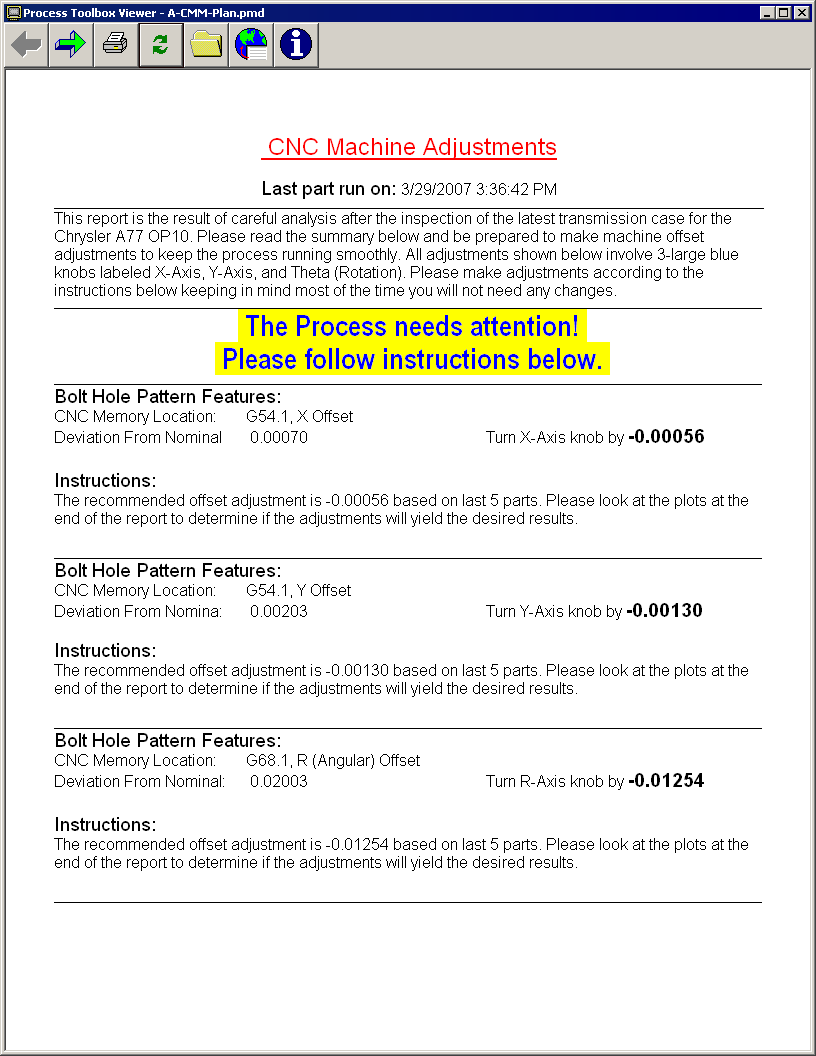
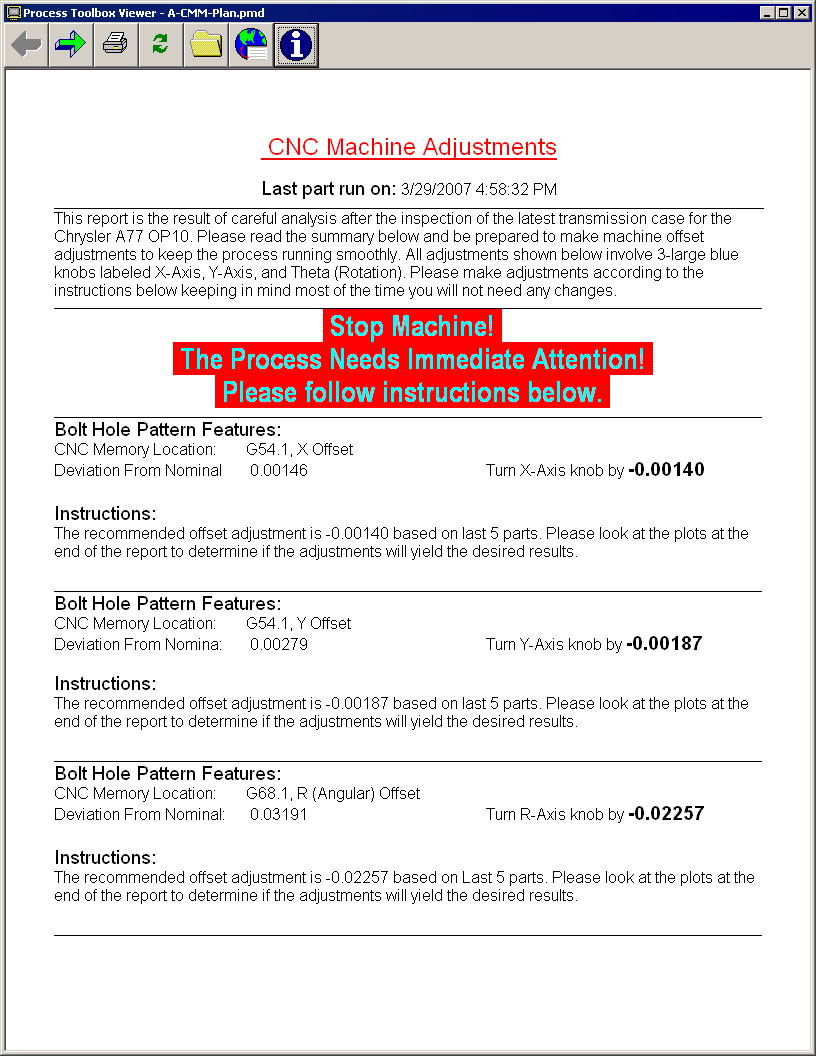
As time passes and the process begins to shift, the Process Toolbox Viewer continues triggering automatic reports on the machine operator’s monitor. Here we see the process is in need of adjustment and by how much. The process engineer has entered enough knowledge into the document to help the operator fine tune his machine.
The Process is Bad
As time passes and the process gets worse the Process Toolbox Viewer continues triggering automatic reports on the machine operator’s monitor. This time we’ve reach a critical point where the machine must be stopped. If the operator makes the recommended adjustments, he can click the green arrow button the see graphically what the Viewer is trying to tell him. The next page shows the bad part with the out-of-spec bolt hole pattern.
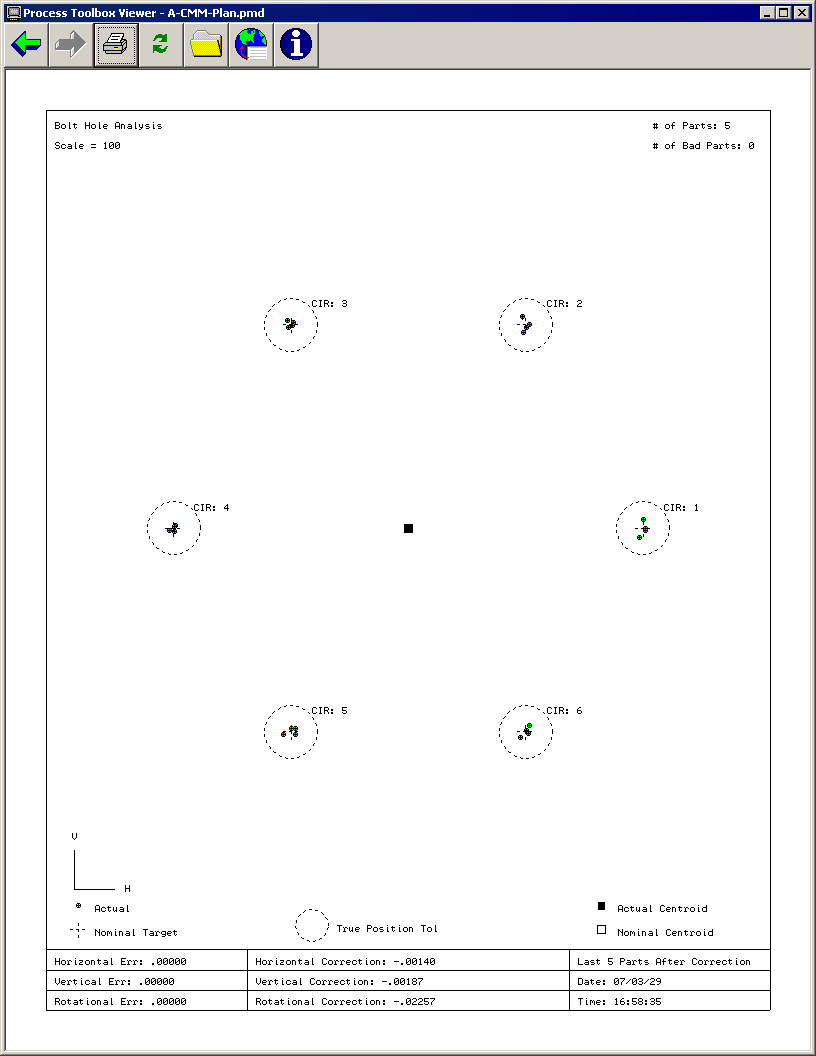
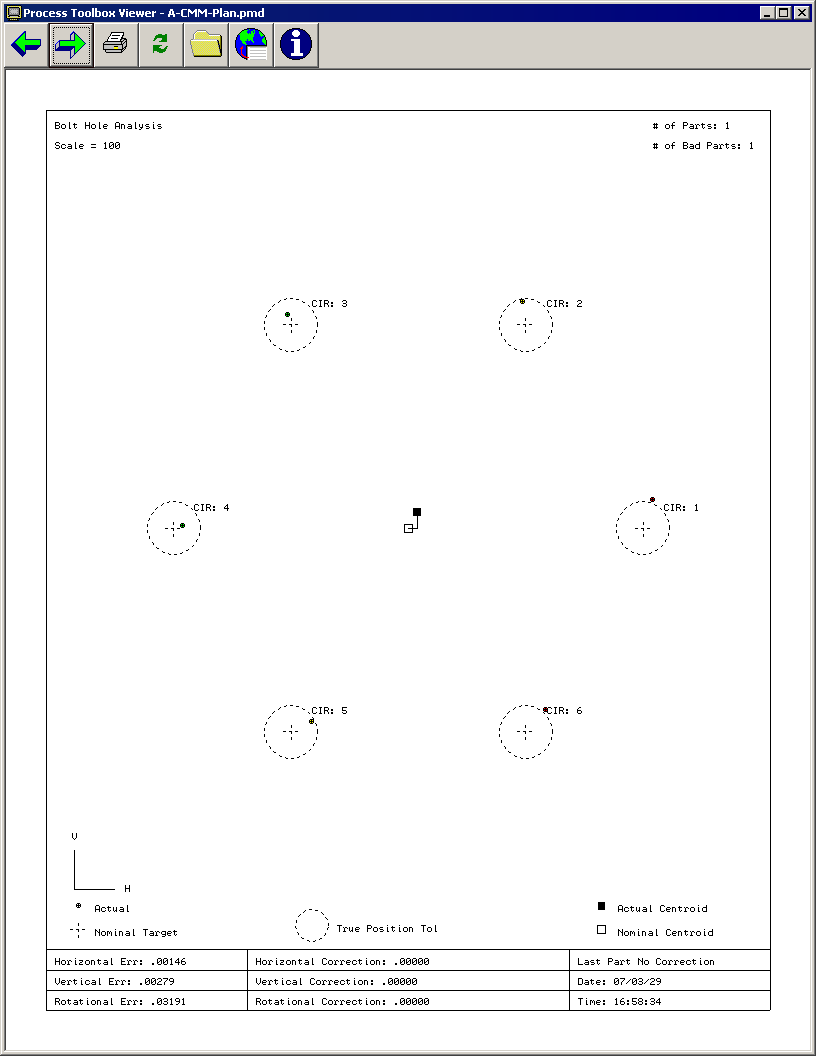
Here we see the bad part’s pattern and clearly Cir 1, and Cir 6 centers are outside of the true position tolerance ring. Also note the centroid of the bolt hole pattern is not centered. This is depicted by the black & white squares in the middle of the diagram.
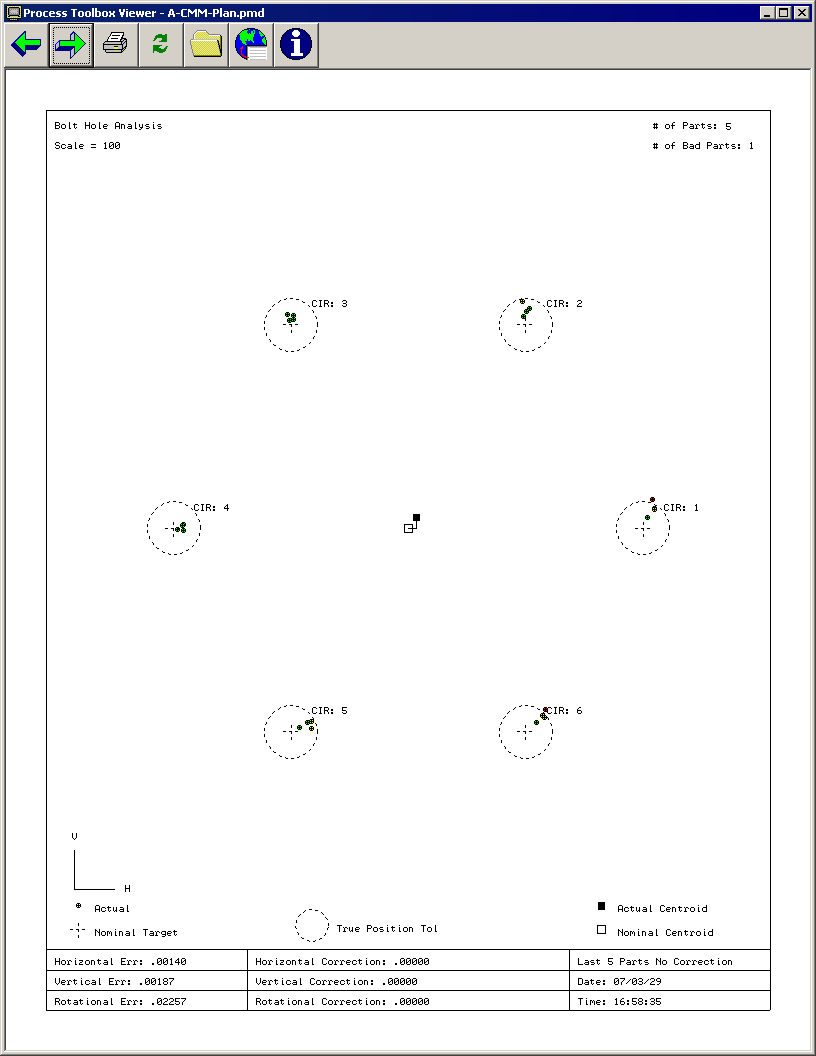
Clicking the right green arrow brings us to the next screen showing the centering of the last 5 parts before the adjustments are made.
Finally, clicking the right green arrow one more time brings us to the last screen showing the position of the last 5 parts if the recommended adjustments are made. Notice how the centroid of the pattern is corrected to nominal position and the clustering of the individual holes are as close to nominal as possible. This on-screen report gives the operator the confidence that his adjustments will center the process correctly.
