Combining Results from the Measure-X Measure and Analyze Tabs in a Single QC-CALC Real-Time Database
Using Measure-X v9.00.05 and QC-CALC Real-Time v4.3.20
- Create a MeasureFit Project (.mfp) file in Analyze
- Start a new Routine in MX
- Switch to the Analyze tab
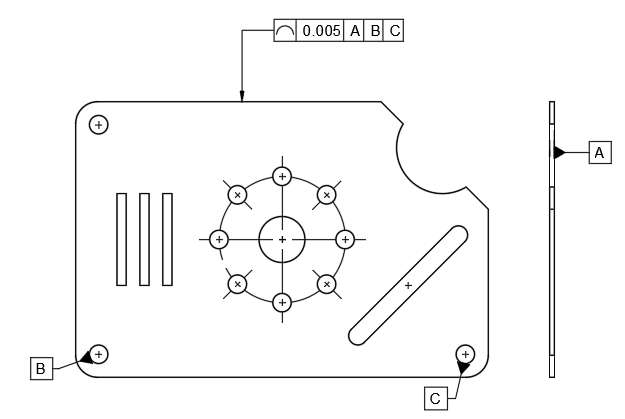
- Import Nominal Geometry (.dxf)
- Set material side
- Add the datums (B & C)
- Group the features that make up the outer parameter
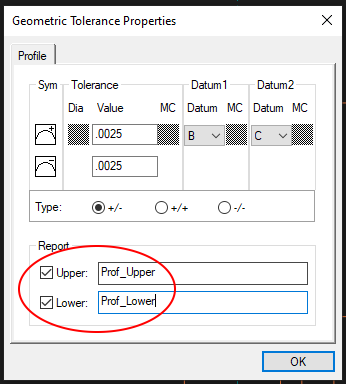
- Add Profile tolerance
- Check and label the Upper and Lower results for output
- Confirm/Set the statistics output filename and path
- Save the project (.mfp)
- Create a Measure-X Routine (.mxi)
- Start a new Routine in MX
- Switch to the Measure tab
- Stage the part
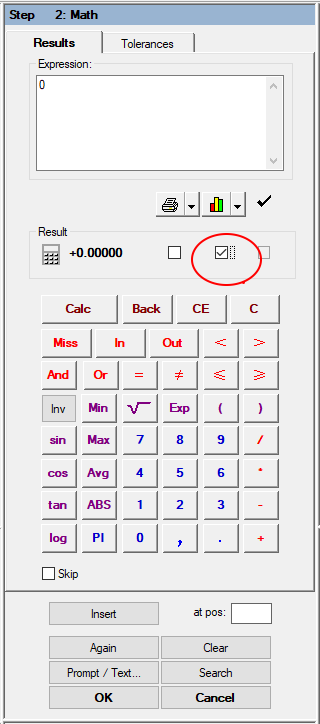
- Add a Math step
- Set the Expression to 0 and clock Calc
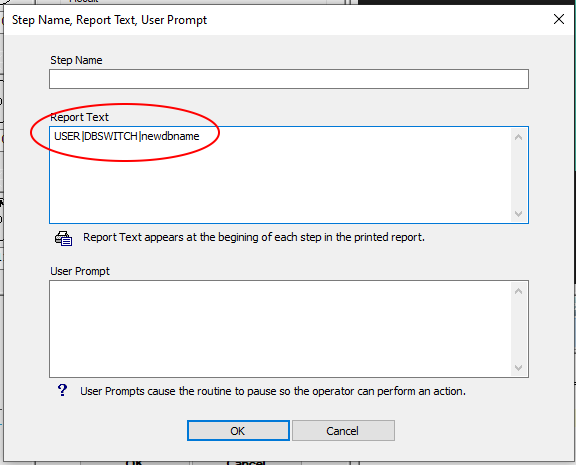
- Enter the DBSWITCH command in the Report Text field
- Enable output to Statistics
- Add a User Input step
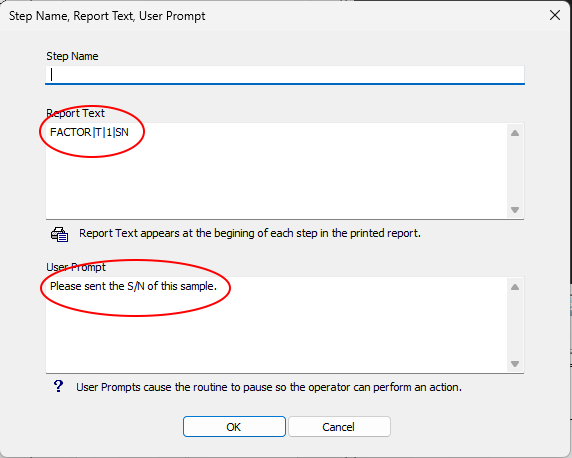
- Enter the FACTOR command in the Report Text field
- Enter the prompt in the User Prompt field
- Enable output to Statistics
- Measure all steps for output (something other than the FACTOR must be sent)
- Enable output to Statistics
- Measure all steps for data point collection
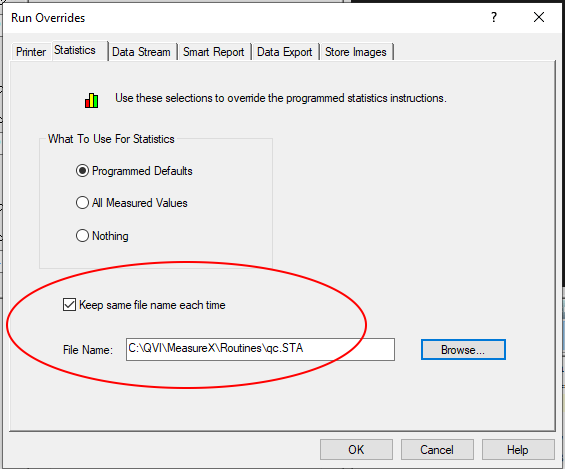
- Enable the "Keep same file name each time" option in the Statistics tab in the Run Overrides
- Save the Routine (.mxi)
- Run the Routine to construct the QC-CALC database with the first data source
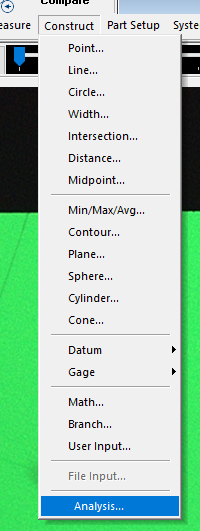
- Add the Analyze step
- Select Construct | Analysis
- Import Nominal Geometry (.mfp)
- Quick Align CAD
- Calculate Results
- Best Fit
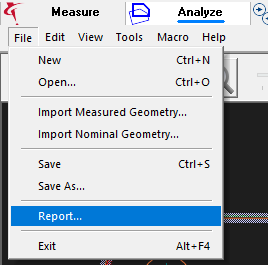
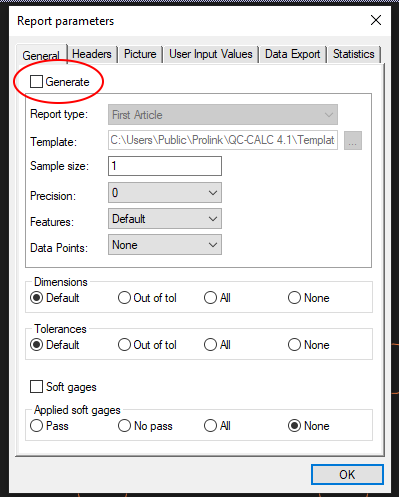
- Select File | Report
- Uncheck Generate on the General tab
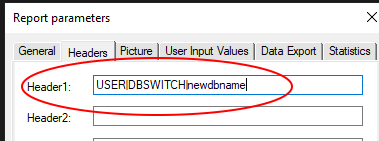
- Add the DBSWITCH command to the Headers tab
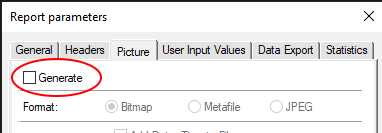
- Uncheck Generate on the Picture tab
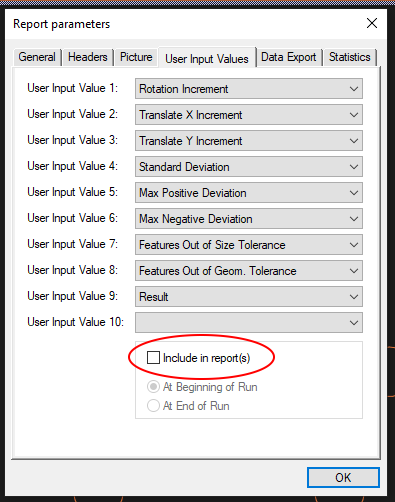
- Uncheck Include in report(s) on the User Input Values tab
- Check Generate on the Statistics tab
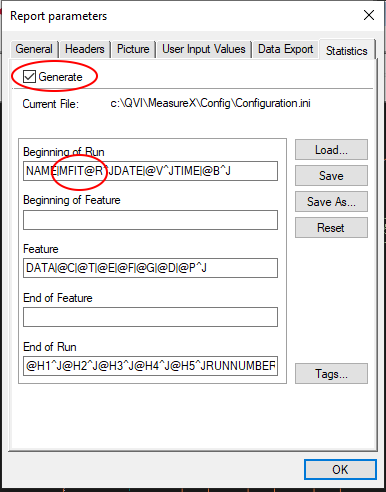
- Ensure the @R term is different (see image)
- Click OK
- Stop the recording of the Macro
- Save the MX Routine (.mxi)