Preparation
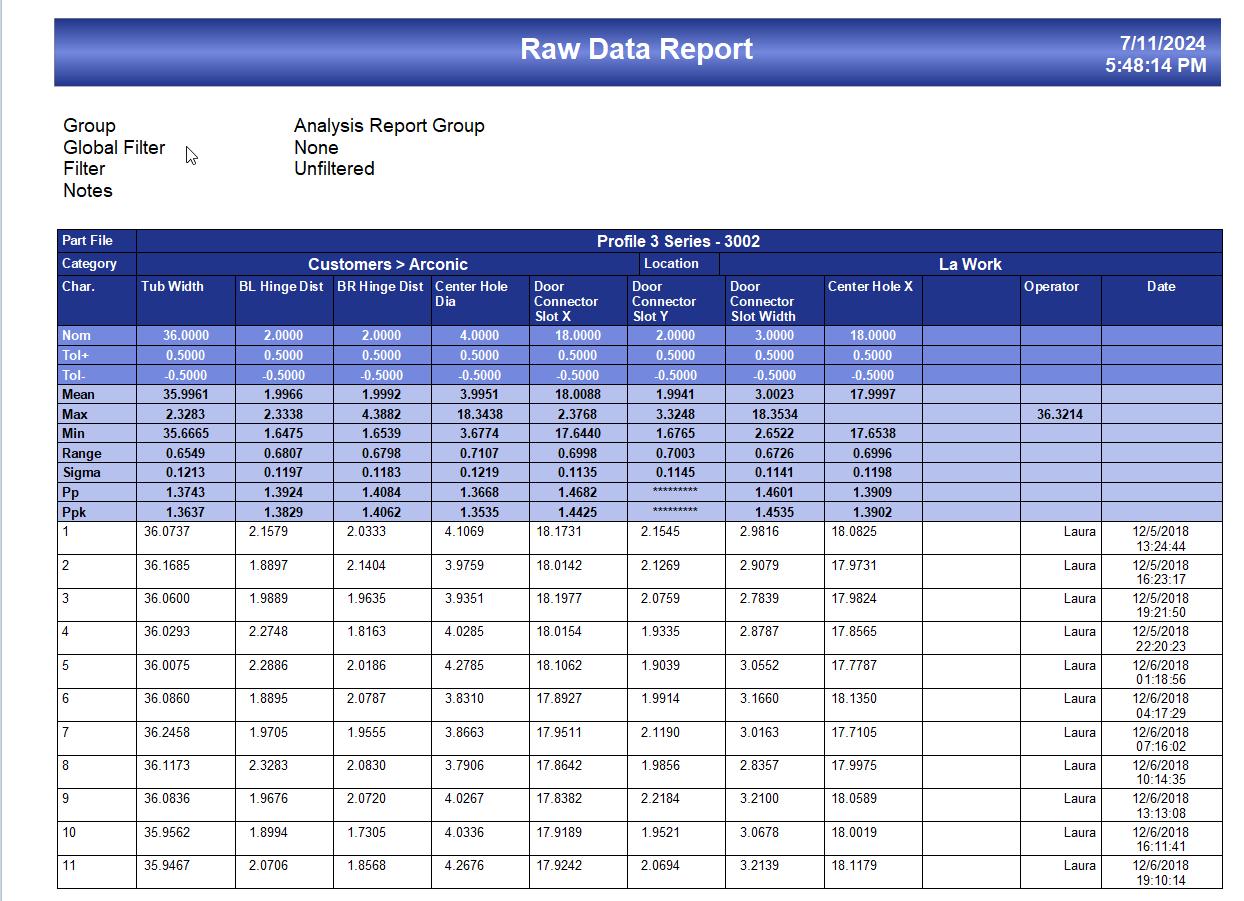
First, we will make a copy of an existing template file to edit. Next, we will use QC-CALC Real-Time to look up the characteristic position number for the characteristic you want to include in the report template. Finally, we will make the necessary changes to add an additional characteristic column to the Raw Data Report template.
Check Characteristic Positions in QC-CALC
Characteristics are referred to by variables in the Report Designer such as char_label_01. To make sure you use the correct variables for the characteristic you need, you can look up these characteristic position numbers in QC-CALC Real-Time:
- In QC-CALC Real-Time, to open the part file for which you are creating the report template, go to File > Open and select the file you need.
- Go to File > Properties... > Edit Nominals & Tolerances.
- In the window that opens, look in the Characteristics sections in the list on the left. You may have to scroll to the bottom of that list to find them.
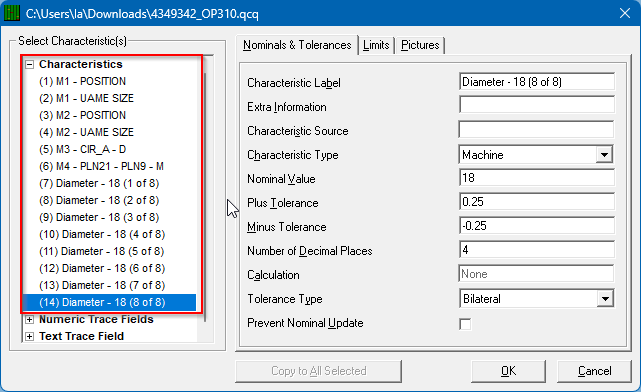
- Note the number in parentheses to the left of the characteristic labels for the characteristic you want to add to report. template. You will need to know this number for the Report Designer.
Editing the Template
- In ERS go to Report > Design Templates.
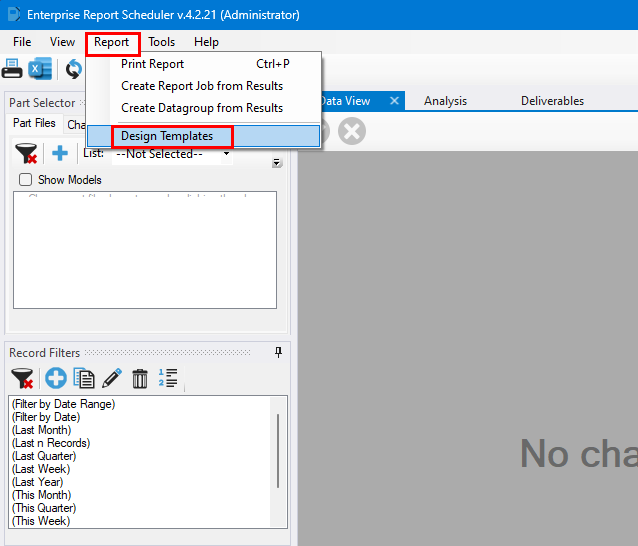
- ERS will prompt you to select a report template. Choose RawDataStats.rdr and select Open.
- Now the Report Designer window will open with the selected report template.
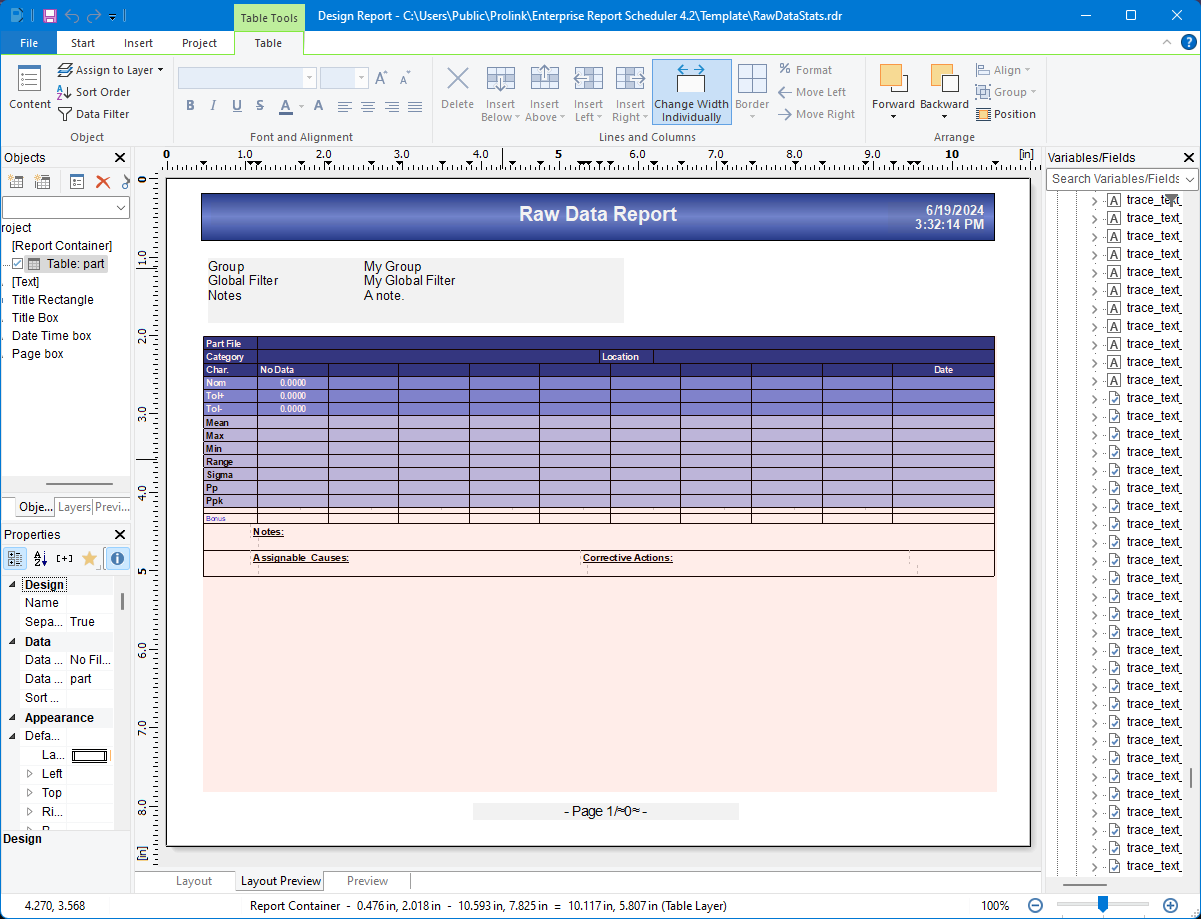
- Go to File > Save As to save the template file with a new name so you don't modify the original template.
- Select the Projects tab in the Objects pane on the top left side of the Report Designer window.
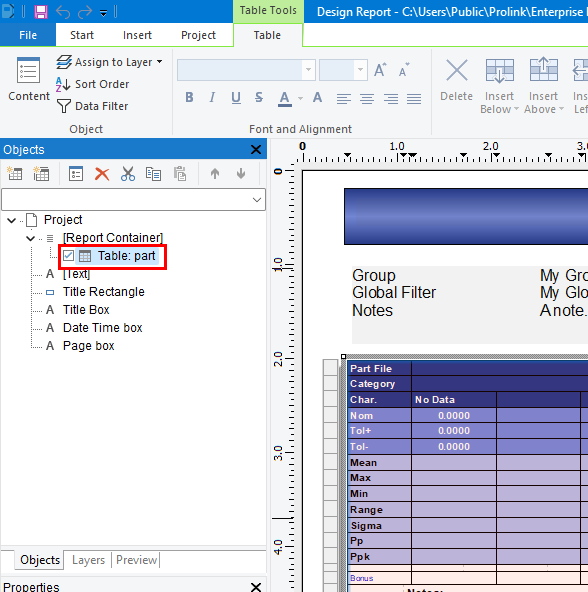
- Double-click on the "Table: part" section in the Table of Contents list in the upper left to open the editor window.
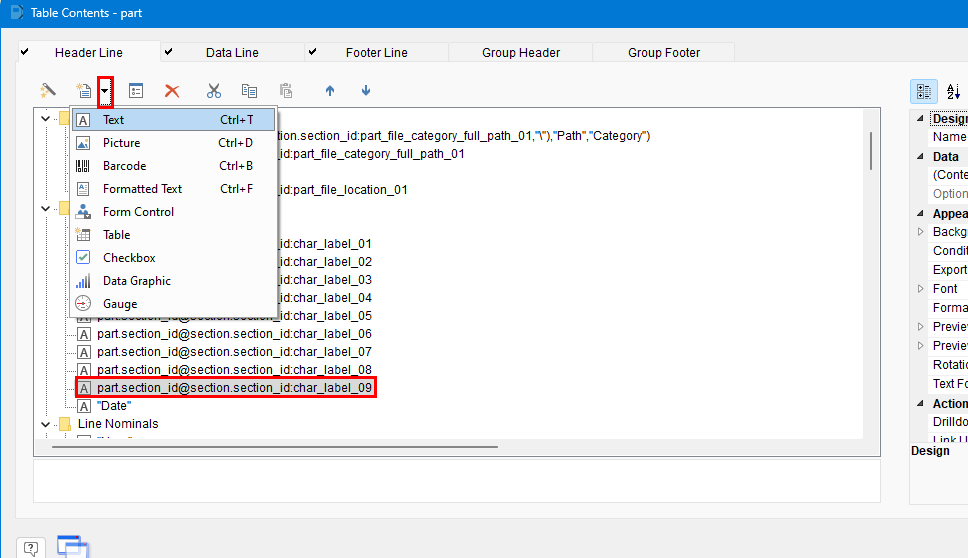
- On the Header Line tab, under the section "Line Char Labels", select the last line before "Date".
- Click the little downward facing arrow next to the Append Column button
 . Select Text.
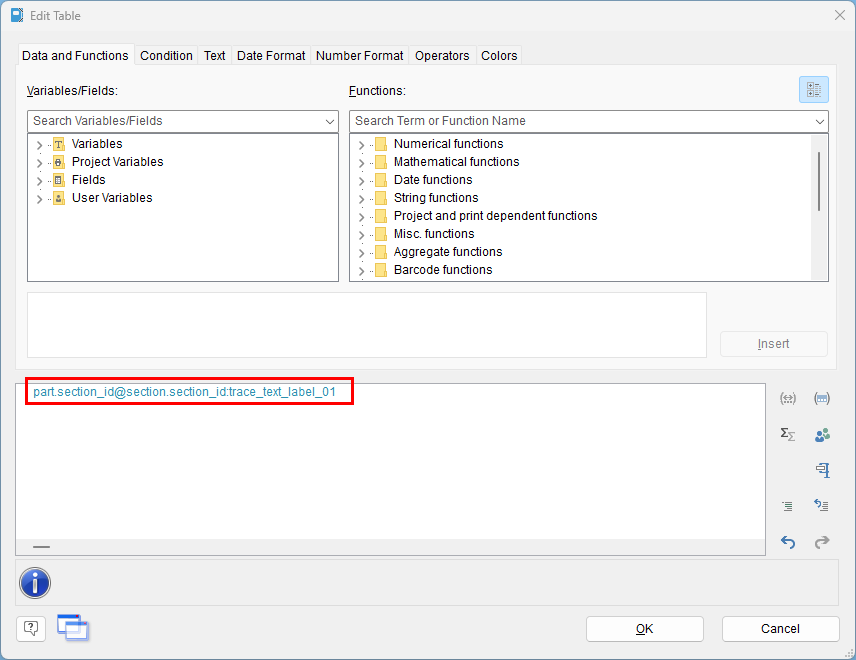
- In the Edit Table window, edit the "09" to match the characteristic position you obtained from step 4:
part.section_id@section.section_id:char_label_10
- Click OK to save the changes.
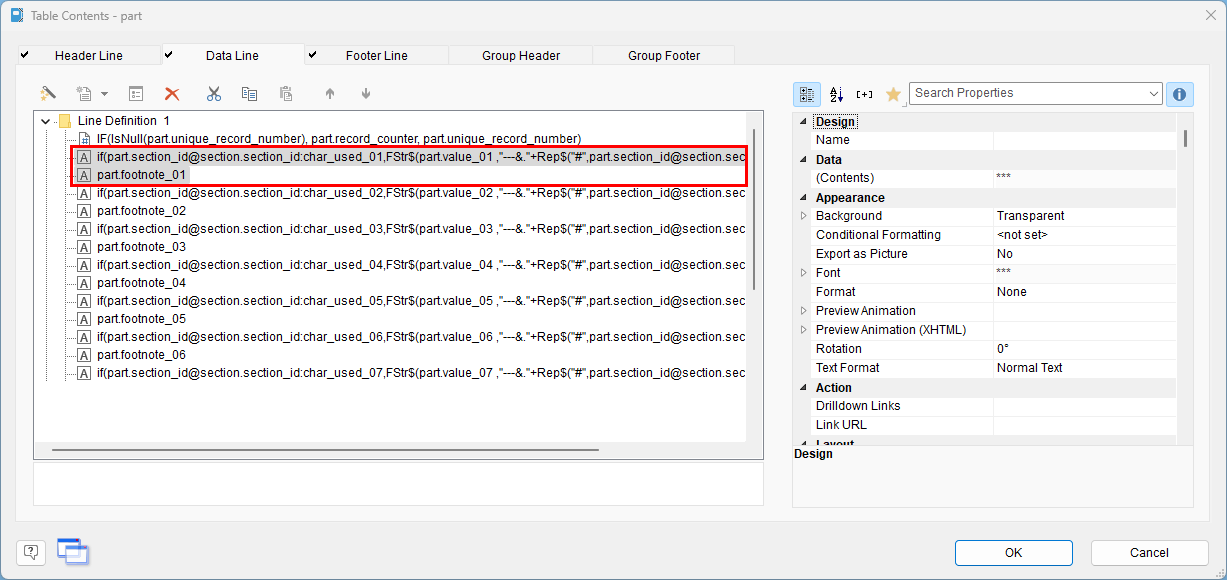
- Select the Data Line tab. Under "Line Definition 1" select the first two lines that form a pair, these are for part 1.
- Click the Copy button (
 ) above the line definitions to copy the selected lines.
- Select
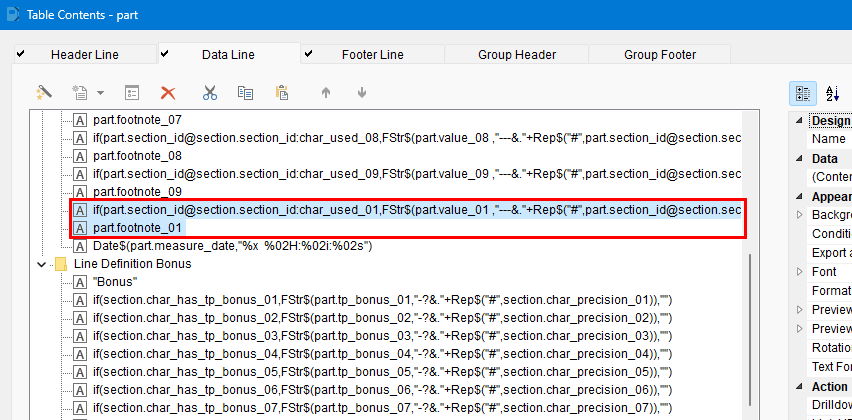
part.footnote_09, right-click, and choose the Paste button ( ). Now the end of the "Line Definition 1" section should look like this:
- Double-click on the first new line you just added to edit it.
Edit the number "09" that appears multiple times in the variable names and set it to the characteristic position number you obtained from step 4. In the example below, I am using "10".
if(part.section_id@section.section_id:char_used_10,FStr$(part.value_10 ,"---&."+Rep$("#",part.section_id@section.section_id:char_precision_10)),"")
part_footnote_10
This tells ERS that if characteristic "10" exists in the part file, print the measurement values for characteristic #10. If that characteristic doesn't exist in your data the column will remain blank.
- If you look at the Nominal row, it has 11 boxes but the row beginning "Char." has 12 boxes. You will have to add an additional column to the stats sections in the middle of the report template.
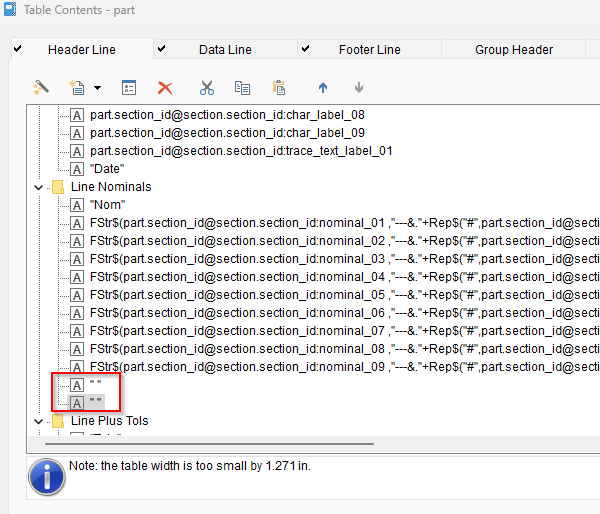
- Under the Header Line tab, select and copy the last line under the "Line Nominals" section, which is just two quotes: " "
- Use the Paste button (
 ) to paste the copied text. Now you should see this:
- Also, be sure to add an extra line of
" " to every other section in the Header Line tab after Line Nominals. These include: Line Plus Tols, Line Minus Tols, Line Mean, Line Max, Line Min, Line Range, Line Sigma, Line Pp, and Line Ppk.
- Next, you will have to manually resize the column width of columns 2 through 10 (these are the columns for the part measurement values). Select the Data Line tab.
- Click on the first of the Data Lines beginning with "if(part.section_id@", this is the data column for the first characteristic in the part file.
- In the Properties window on the right, you will need to adjust the Width value so that all rows and columns remain aligned. You can use Control or Shift keys to select more than one line. This will select multiple columns so you can set the width of each to the same value. Notice that when you select a line in the Table of Contents you will see one of the cells in the report template highlighted so you know which one you are editing.
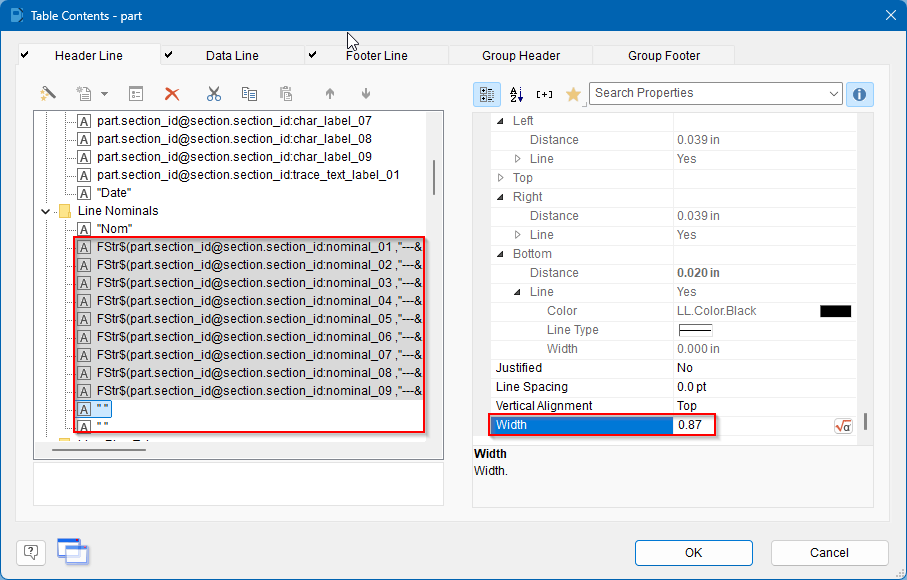
- The width values you need will depend on the number of columns in your template. If you followed the steps here exactly, you can set width of each column, except your trace field column, to
0.85. Set your trace field column's width to 0.7. The last row in each section is the "Date" column. Set the width of this to 1.05 so the Measure Date/Time fits.
Otherwise, the eaisest thing to is use the visual position of other rows and columns as guides. if you've adjusted the width too little or too much the rows/columns will become misaligned which is easy to see in the Report Designer. You can adjust the width values until the rows become aligned again. - When you're finished, go to File > Save or click the
 button to save your template. You can close the Report Designer window.
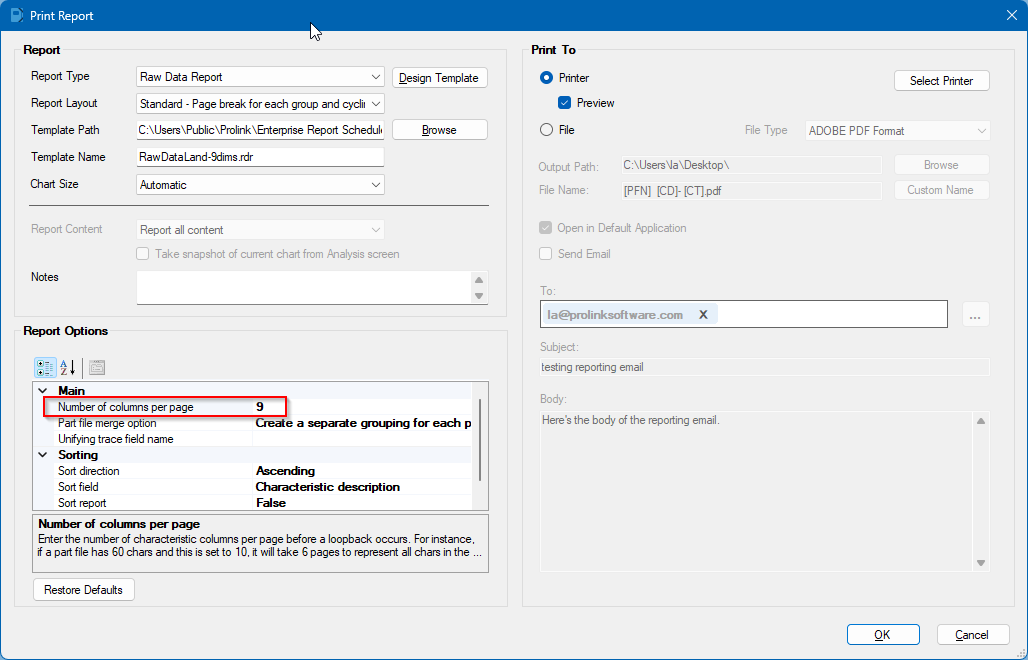
 - Back in the Print Report window, change the setting "Number of columns per page" under Report Options.
This is the number of characteristic columns that are printed on each page. Since we added one column, this number needs to be increased. if you followed the steps above to add one additional column, set it to 1 greater than what it was before.
- Now you can try printing your report to make sure everything looks good.
